Teri Campbell

Product Manager | Clinical PT turned product builder | Now building AI products that help people take the next step
LinkedIn Profile
SQL Hospital Data Project
INTRODUCTION
Project description: This project explored Hospital Data, focusing on diabetic patient admissions in 130 US Hospitals.
Hospital readmissions within 30 days of patient discharge can be costly as well as an indication of an inadequate treatment plan.
Greater length of hospital stay can also have a financial impact on the facility due to insurance reimbursement systems such as Medicare’s prospective payment system.
Balancing length of stay with risk of readmission is important for hospital administration and policy.
This project was focused on gaining insights related to patient demographics and correlations to length of stay.
What I Learned
-
The majority of hospital admissions are less than 7 days
-
Patients who have longer than 1 week hospital stays have a somewhat greater average number of diagnoses
-
The medical specialties that perform the most procedures on average, do not necessarily have the largest number of patients
-
On average, the number of procedures performed increases the longer a patient is in hospital
-
There is evidence of racial differences in medical care provided
DATA
The “diabetic_data” data set was downloaded from Kaggle The data can be found here: https://www.kaggle.com/code/iabhishekofficial/prediction-on-hospital-readmission/data?select=diabetic_data.csv
The data set contains 101,766 rows and 50 fields
This data set contains 10 years (1999-2008) of data collected from 130 US hospitals. Information included in this data meets the following requirements:
- An inpatient encounter is defined as a hospital admission
- The admission includes a diabetic encounter
- Length of stay was between 1 and 14 days
- Laboratory tests were performed during the admission period
- The admission period included the administration of medications
Data was cleaned, filtered, and analyzed using PostgreSQL
More detail about this dataset can be found here: https://archive.ics.uci.edu/ml/datasets/Diabetes+130-US+hospitals+for+years+1999-2008#
ANALYSIS
First, a look at the distribution of time spent in the hospital:
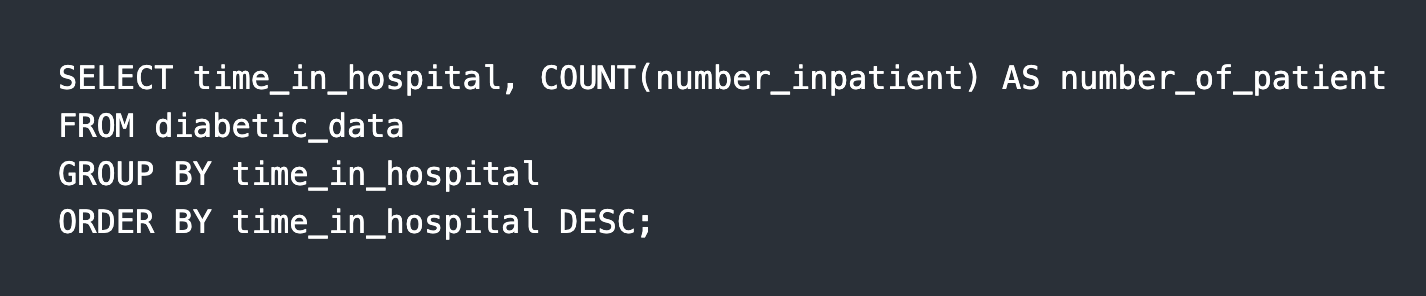
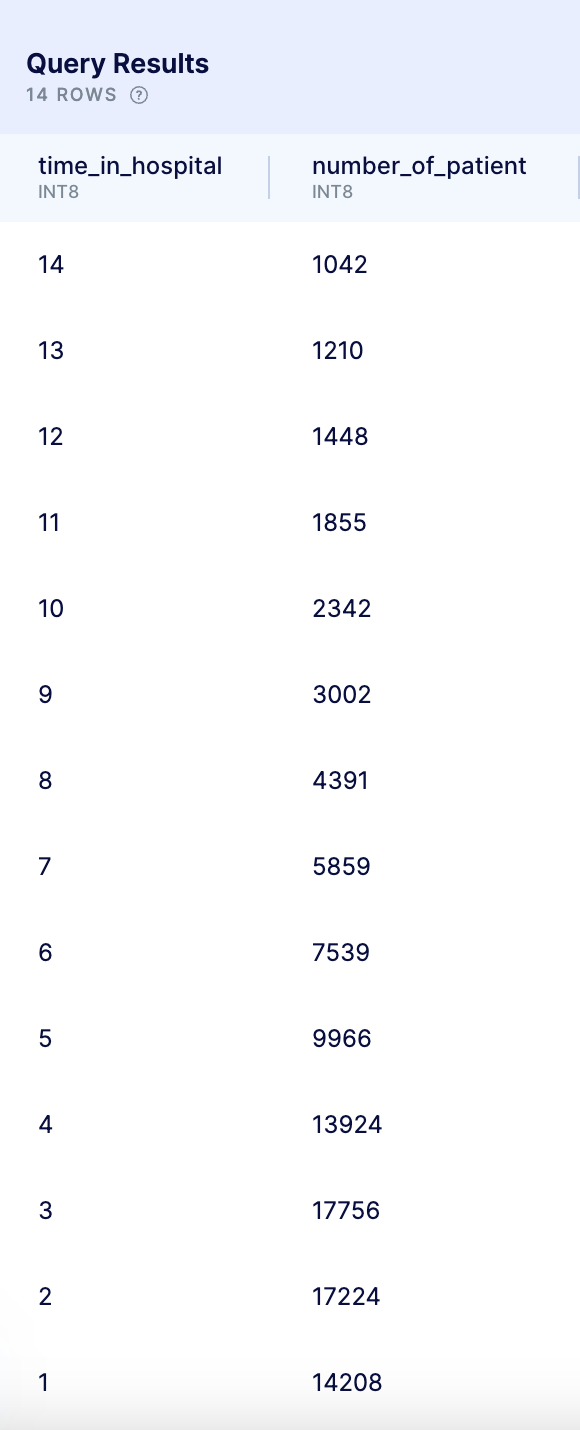
The results do show a pattern, but maybe I’m a bit off on this day, and don’t want to do much mental math.
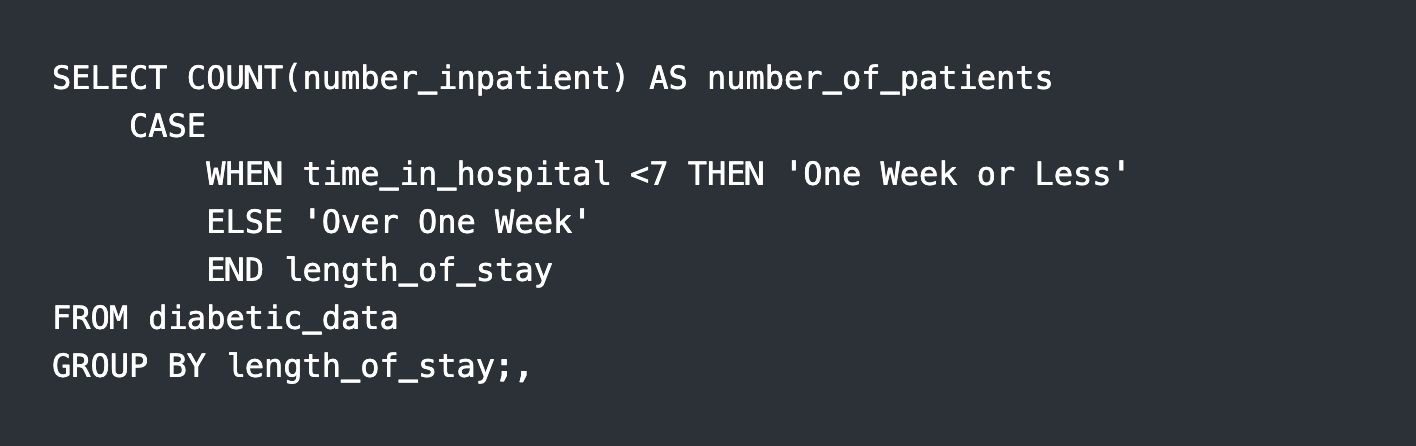
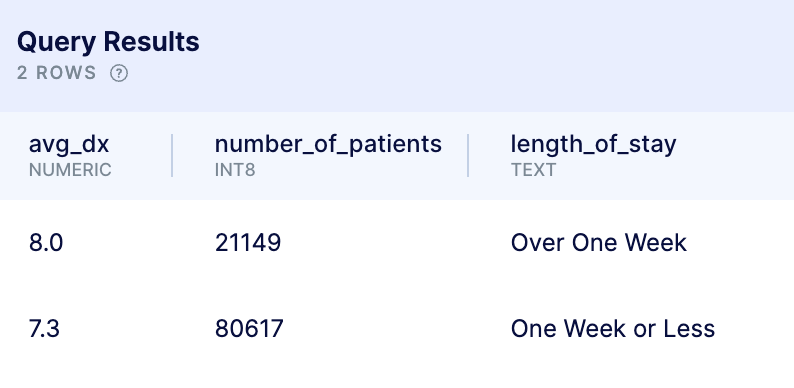
Here is a more clear categorization of how many people stayed a a week or less, and how many were in hospital for longer:
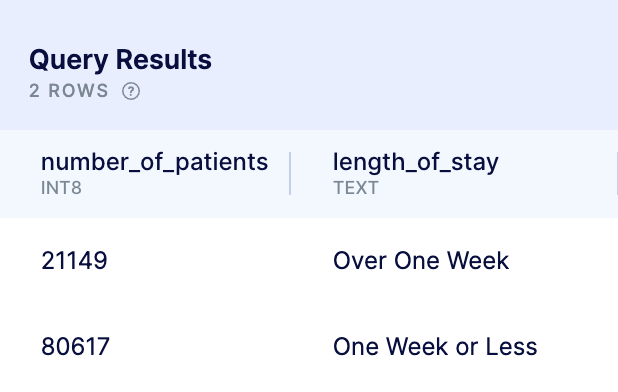
Now let’s say we want to know how sick patients are in each group.
We can look at, on average, how many diagnoses per person there are in each group.
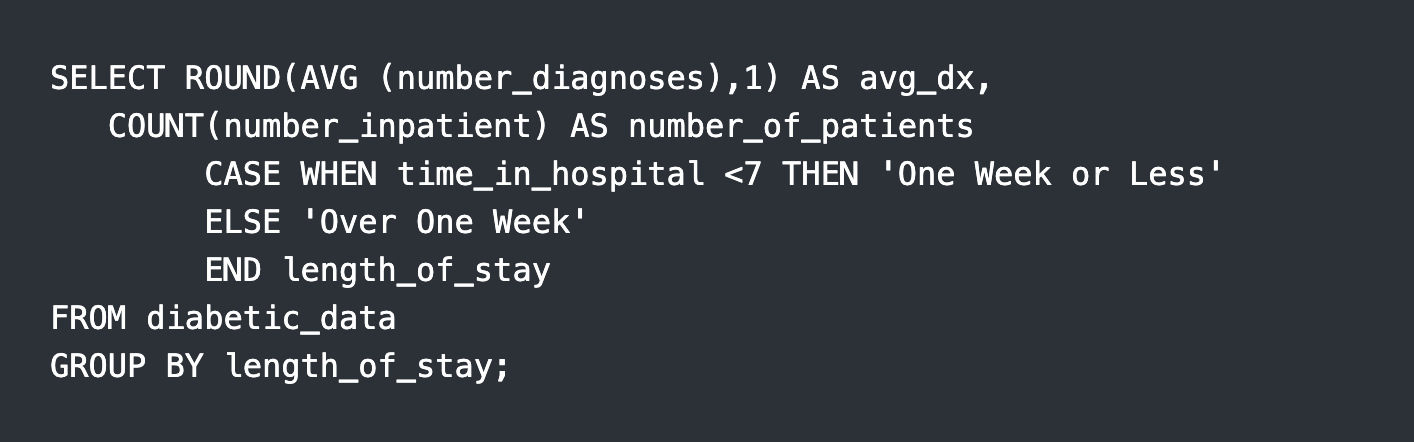
We do see on average a greater number of diagnoses in the group with the longer length of stay.
In hospital service, costs incurred by procedures can be significant for the facility.
Let’s take a look at the top 10 specialties that order the most procedures on average.
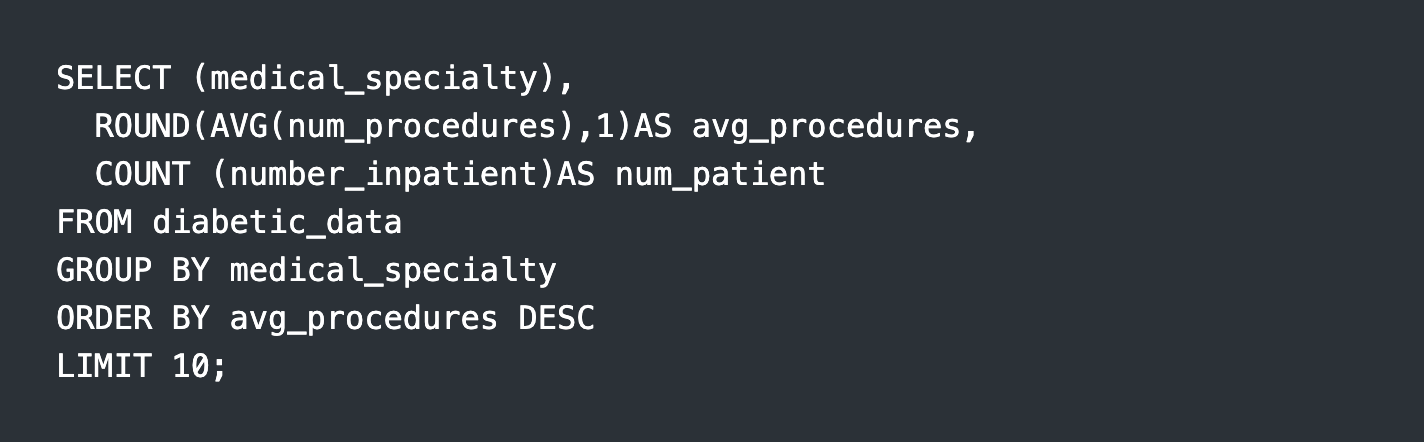
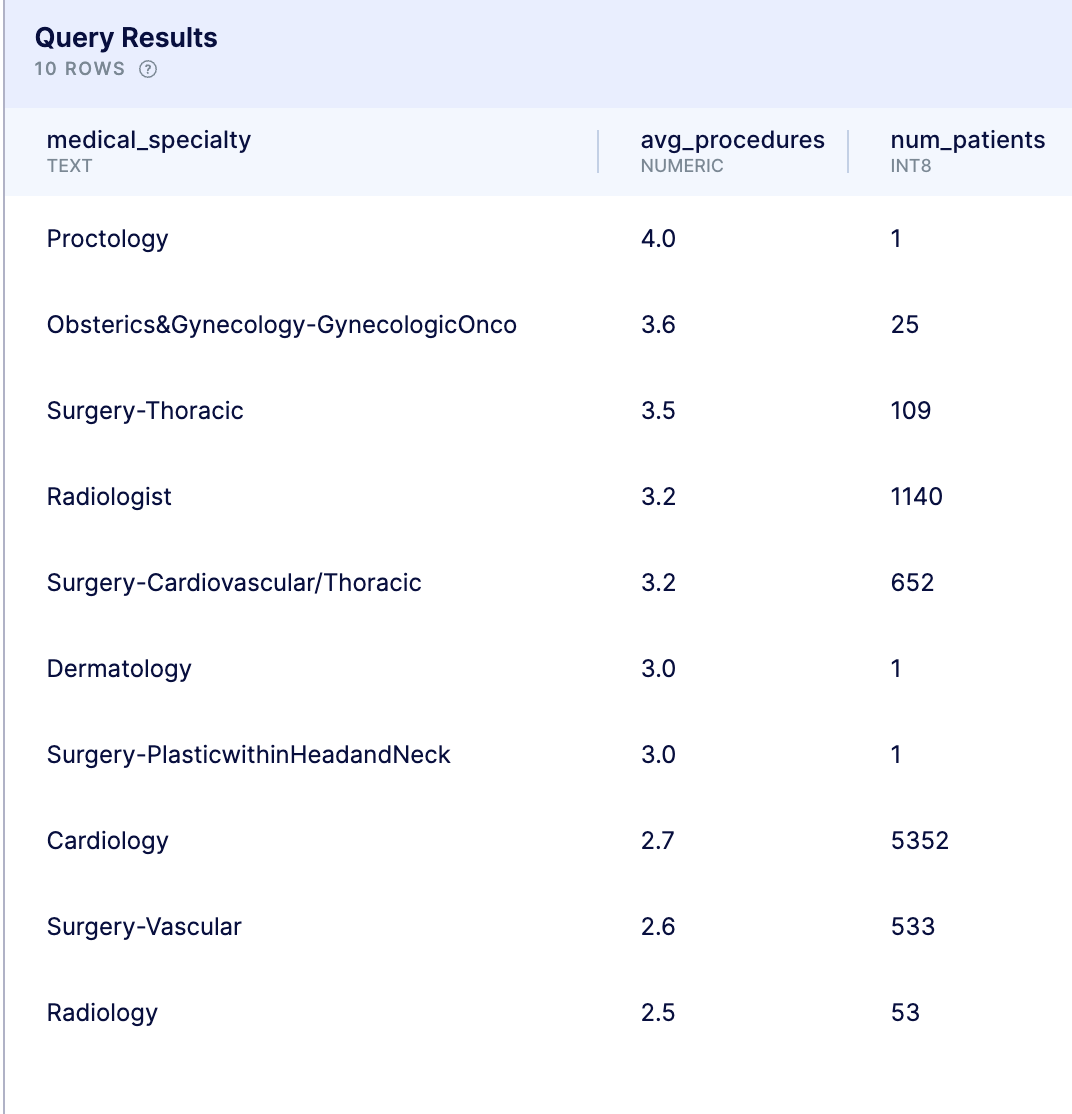
The results show that the medical specialties that have the largest average procedure count do not necessarily have the largest number of patients.
In order for this information to inform business decisions, further exploration is indicated.
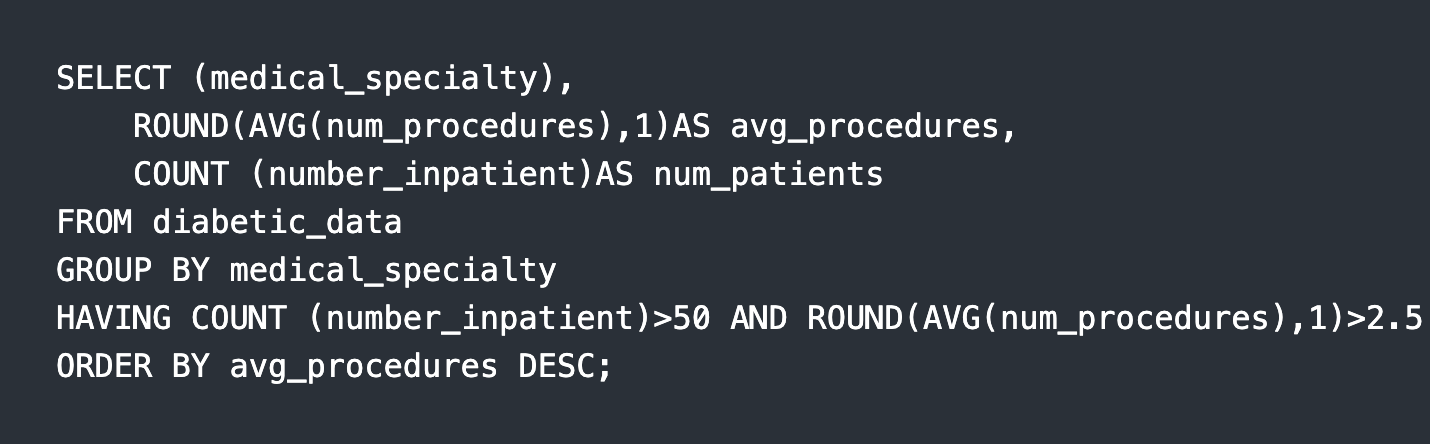
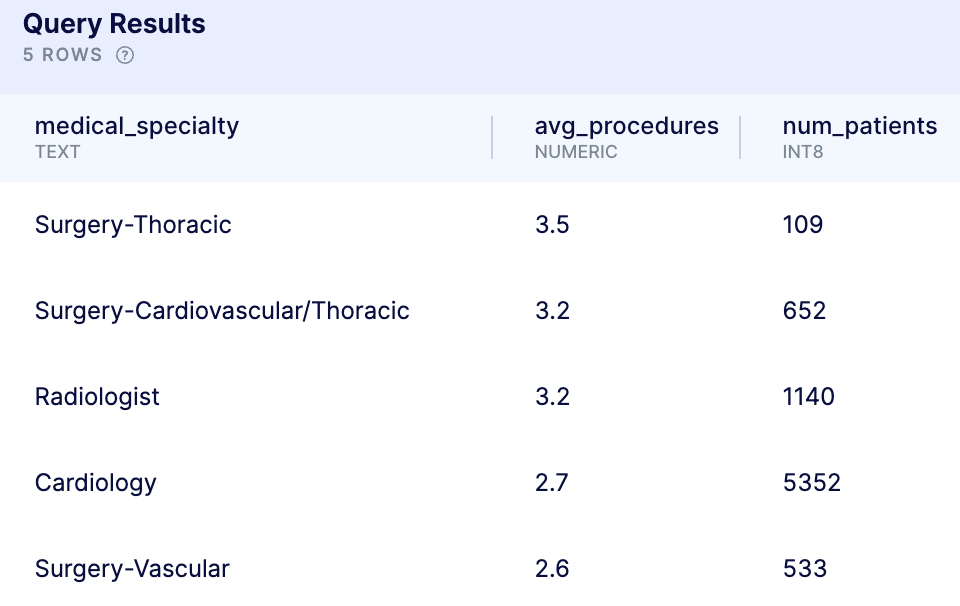
This information can help the facility direct attention toward the specialties that are utilizing the most resources.
A hospital facility has further interest in understanding if the number of lab procedures might correlate to the number of days in hospital.
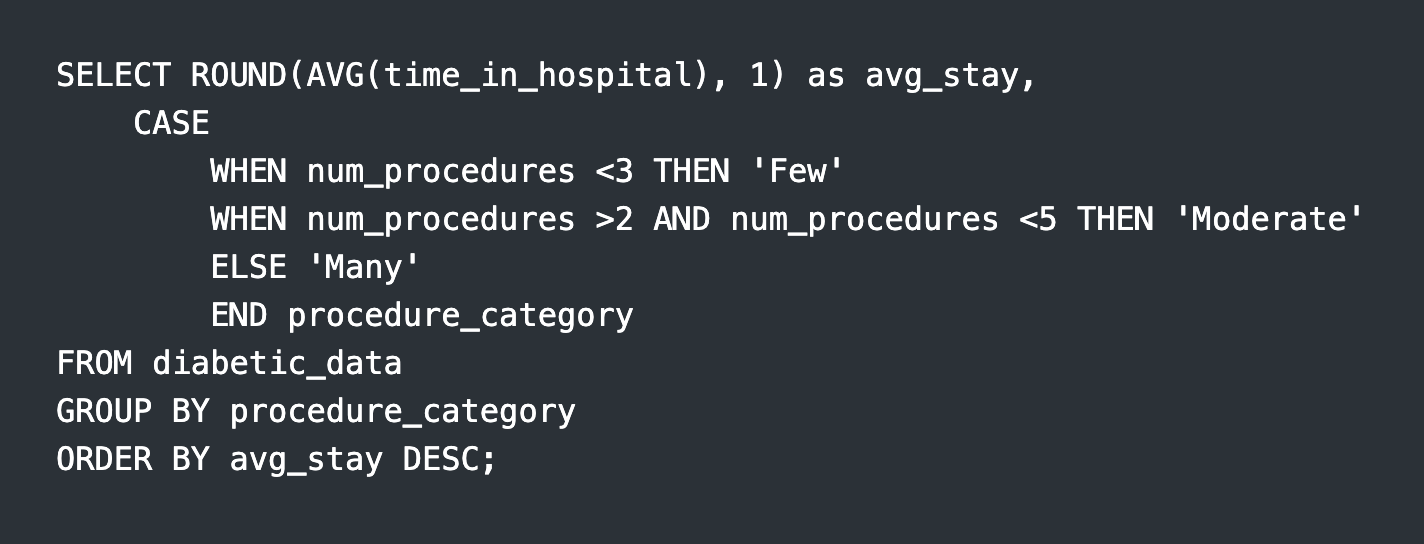
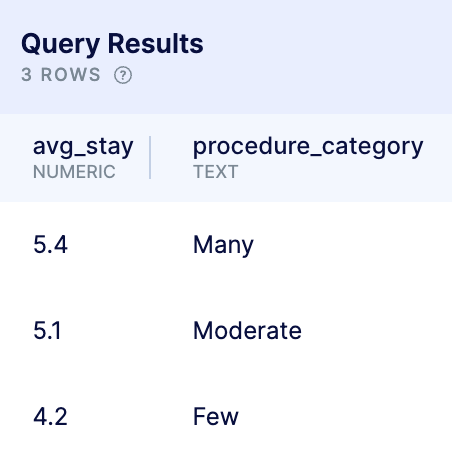
As expected, there is an increase in the average number of procedures performed the longer the hospital stay.
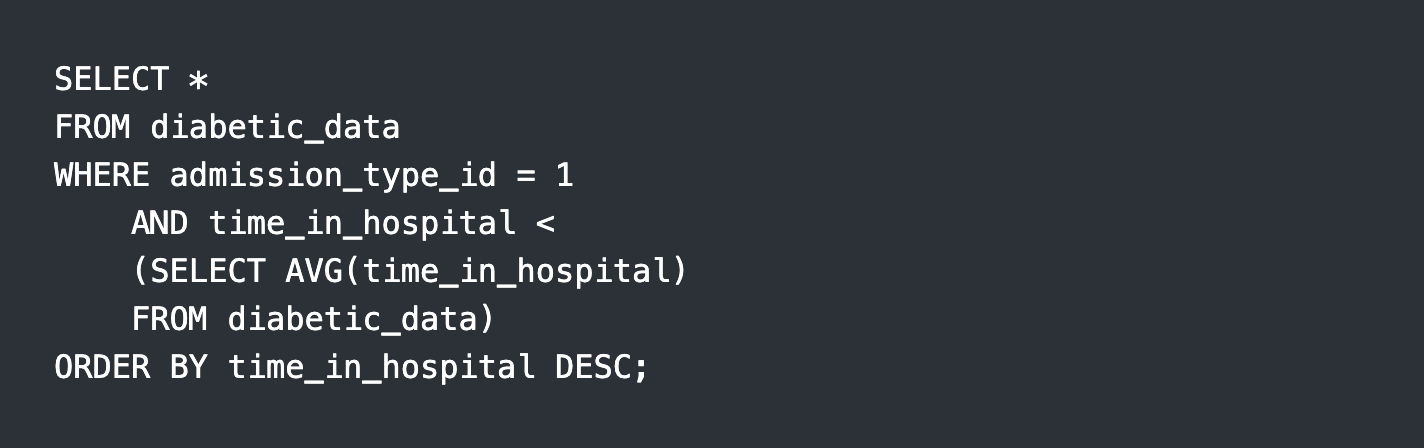
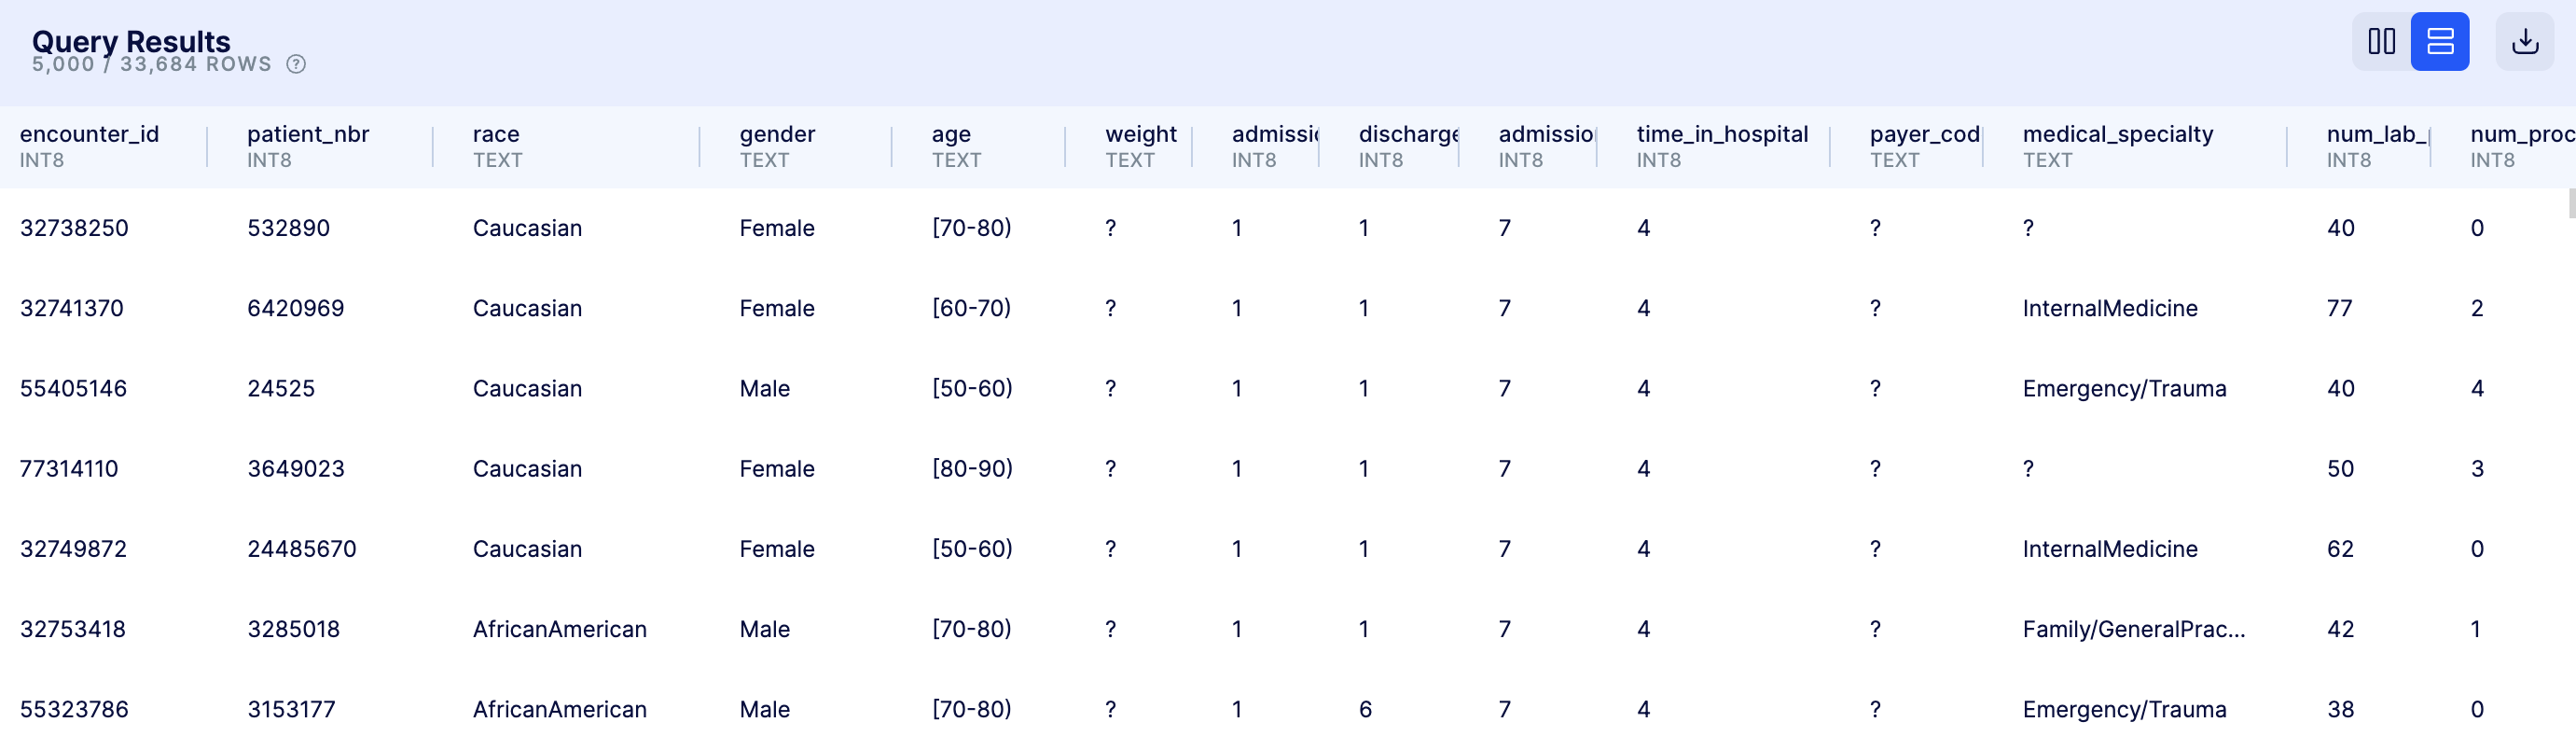
A facility should understand what is going well and benefitting both patients and the business. Here we explore data from patients who had an emergency admission, but who stayed less than the average time in the hospital.
In addition to costs, a facility must be aware of any subconscious bias when providing care. We can, for example, look at specific services and compare how care is provided across different demographics.
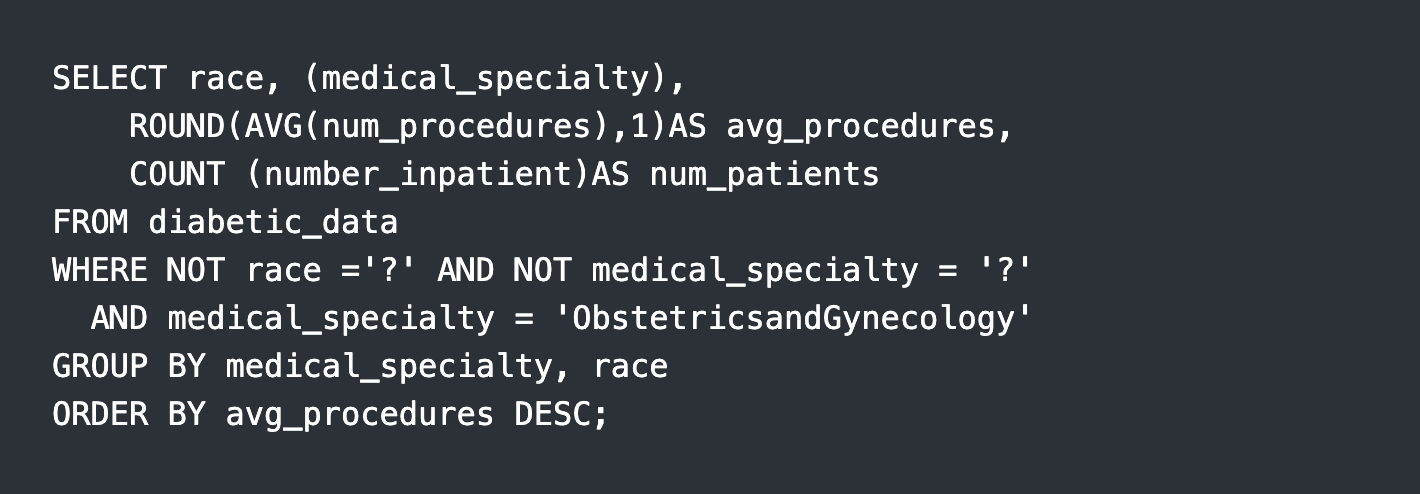
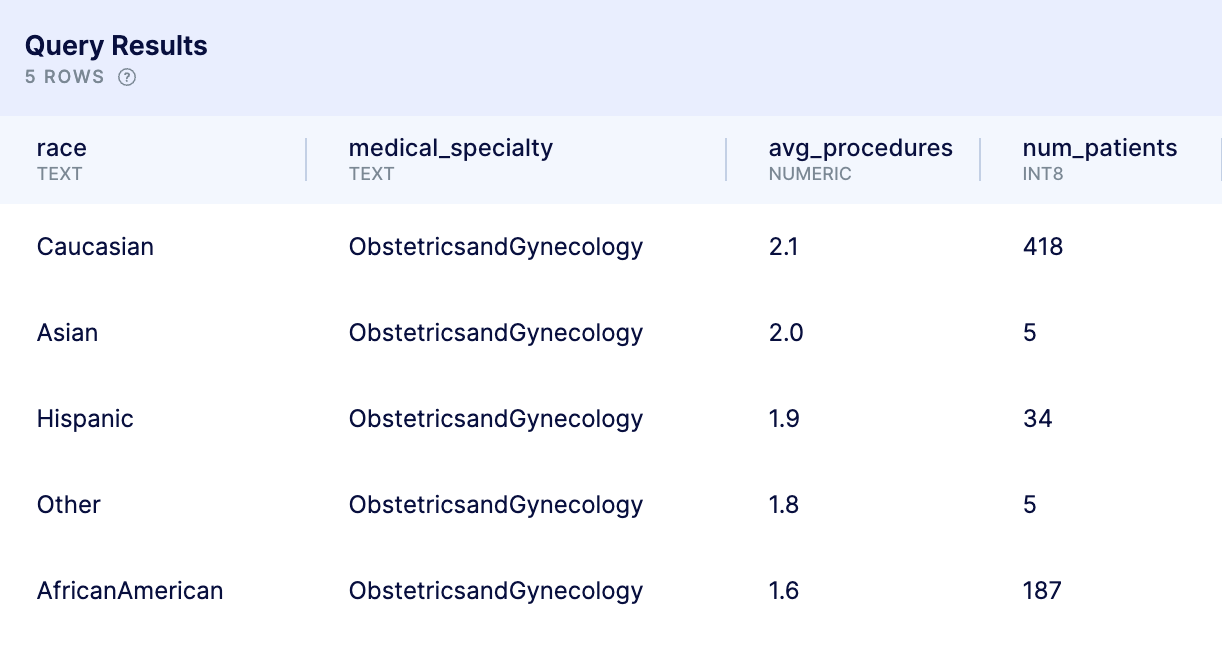
The above example reveals a need to explore deeper and address underlying contributing factors to what appears to be a racial discrepancy in obstetric and gynecological care practices.
The facility management team will also be interested in readmission status in the specialty service of interest.
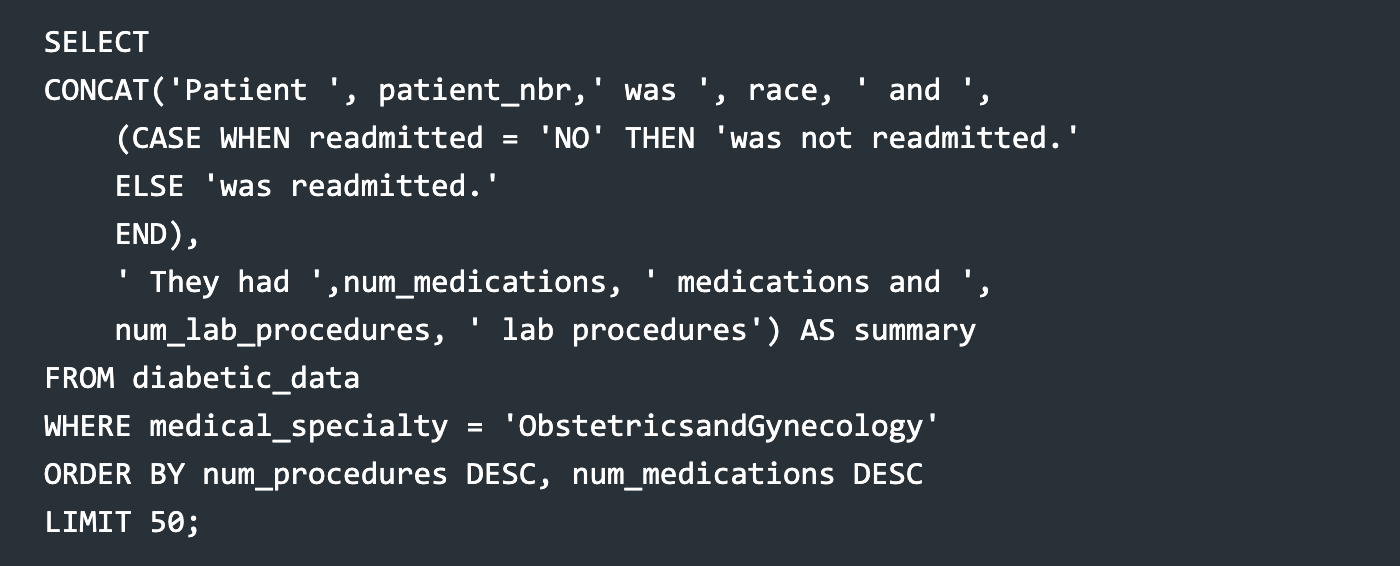
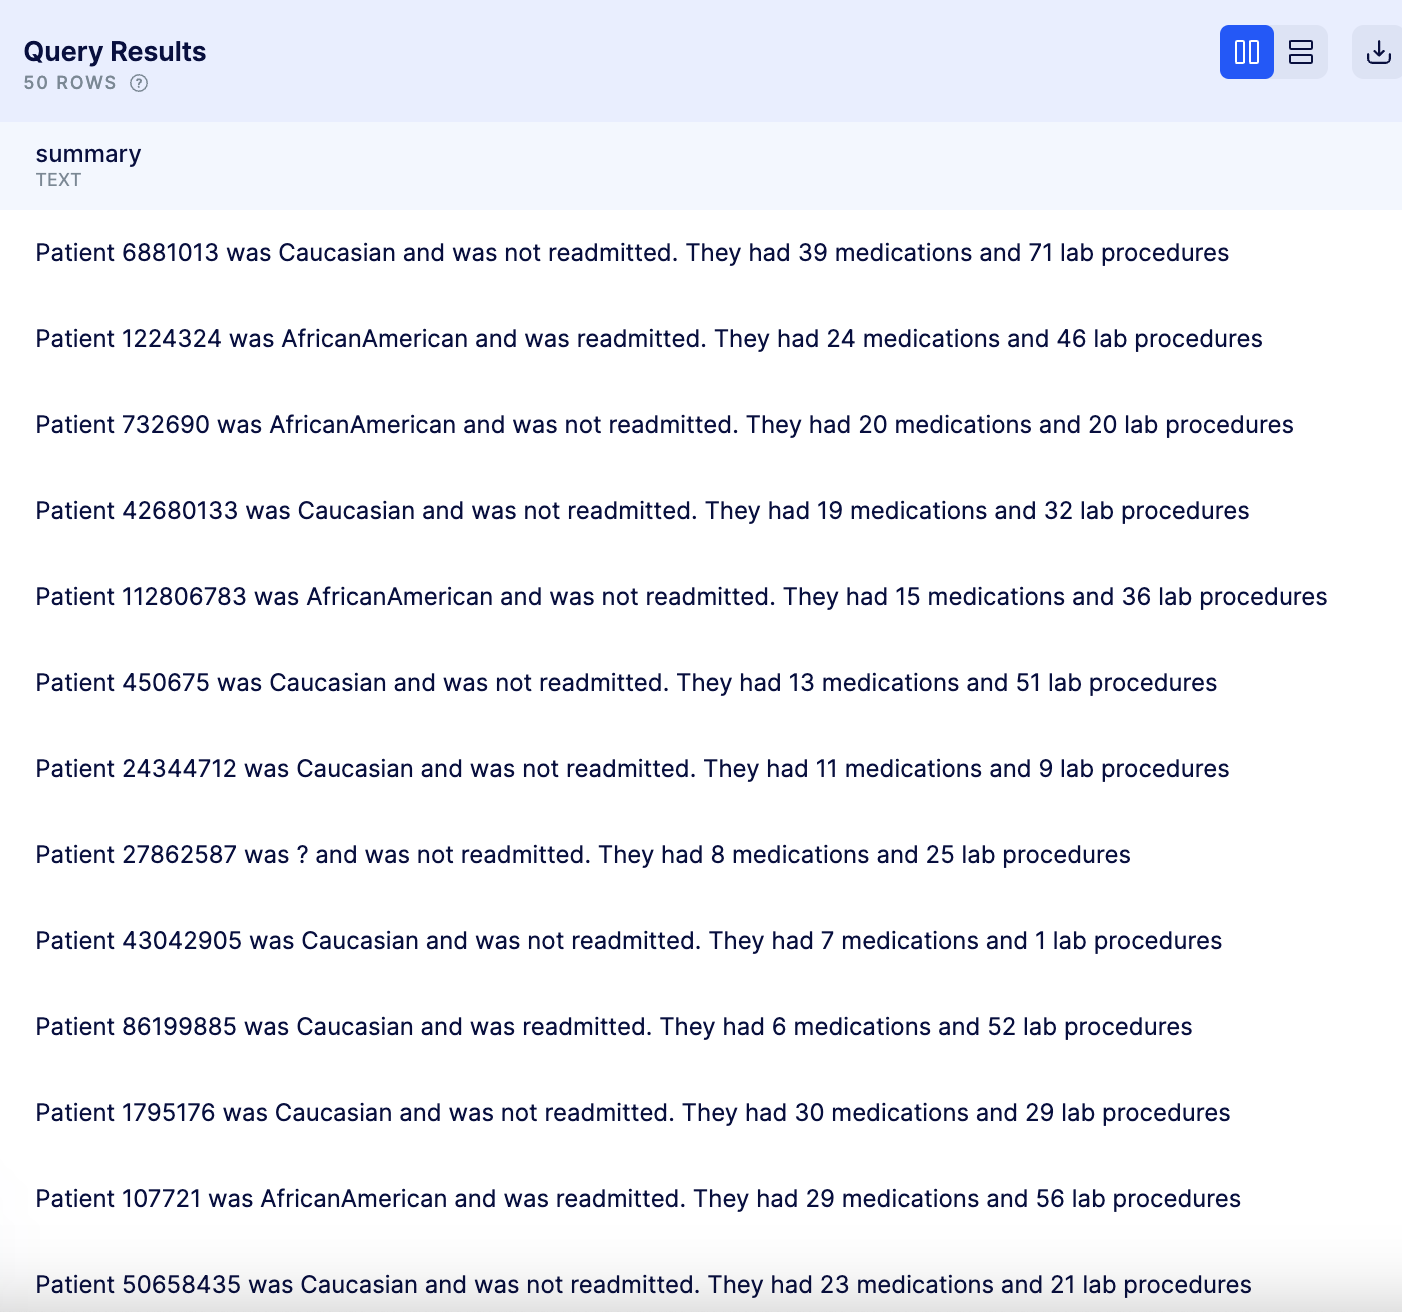
This easy to read set of results can serve as a template to help with a targeted investigation based on re-admission status.
RESULTS
The above analysis provides these insights:
- The majority of hospital admissions are less than 7 days
- Patients who have longer than 1 week hospital stays have a somewhat greater average number of diagnoses
- The medical specialties that perform the most procedures, on average, do not necessarily have the largest number of patients
- On average, the number of procedures performed increases the longer a patient is in hospital
- There is evidence to explore racial difference in the provision of medical care
CONCLUSION AND RECOMMENDATIONS
Facilities can utilize insights from analysis such as that performed in this project to understand factors influencing patient care outcomes as well as financial impacts.
Following trends over time for countries receiving loans could reveal successes and failures in the lending process and is worth further exploration.
The information gathered can guide policy, strategy, and staff education.
Regular analysis is indicated to stay on top of the impacts of these changes as well as health trends that may require updated strategies and policies.
Further research is also indicated to understand potential differences in care provided to patients of different races and demographics.